


The Alcuin Society Awards: Creating a Dataset and Looking at Rates of New Winners over Time
This post was also published on the Alcuin Society’s blog.
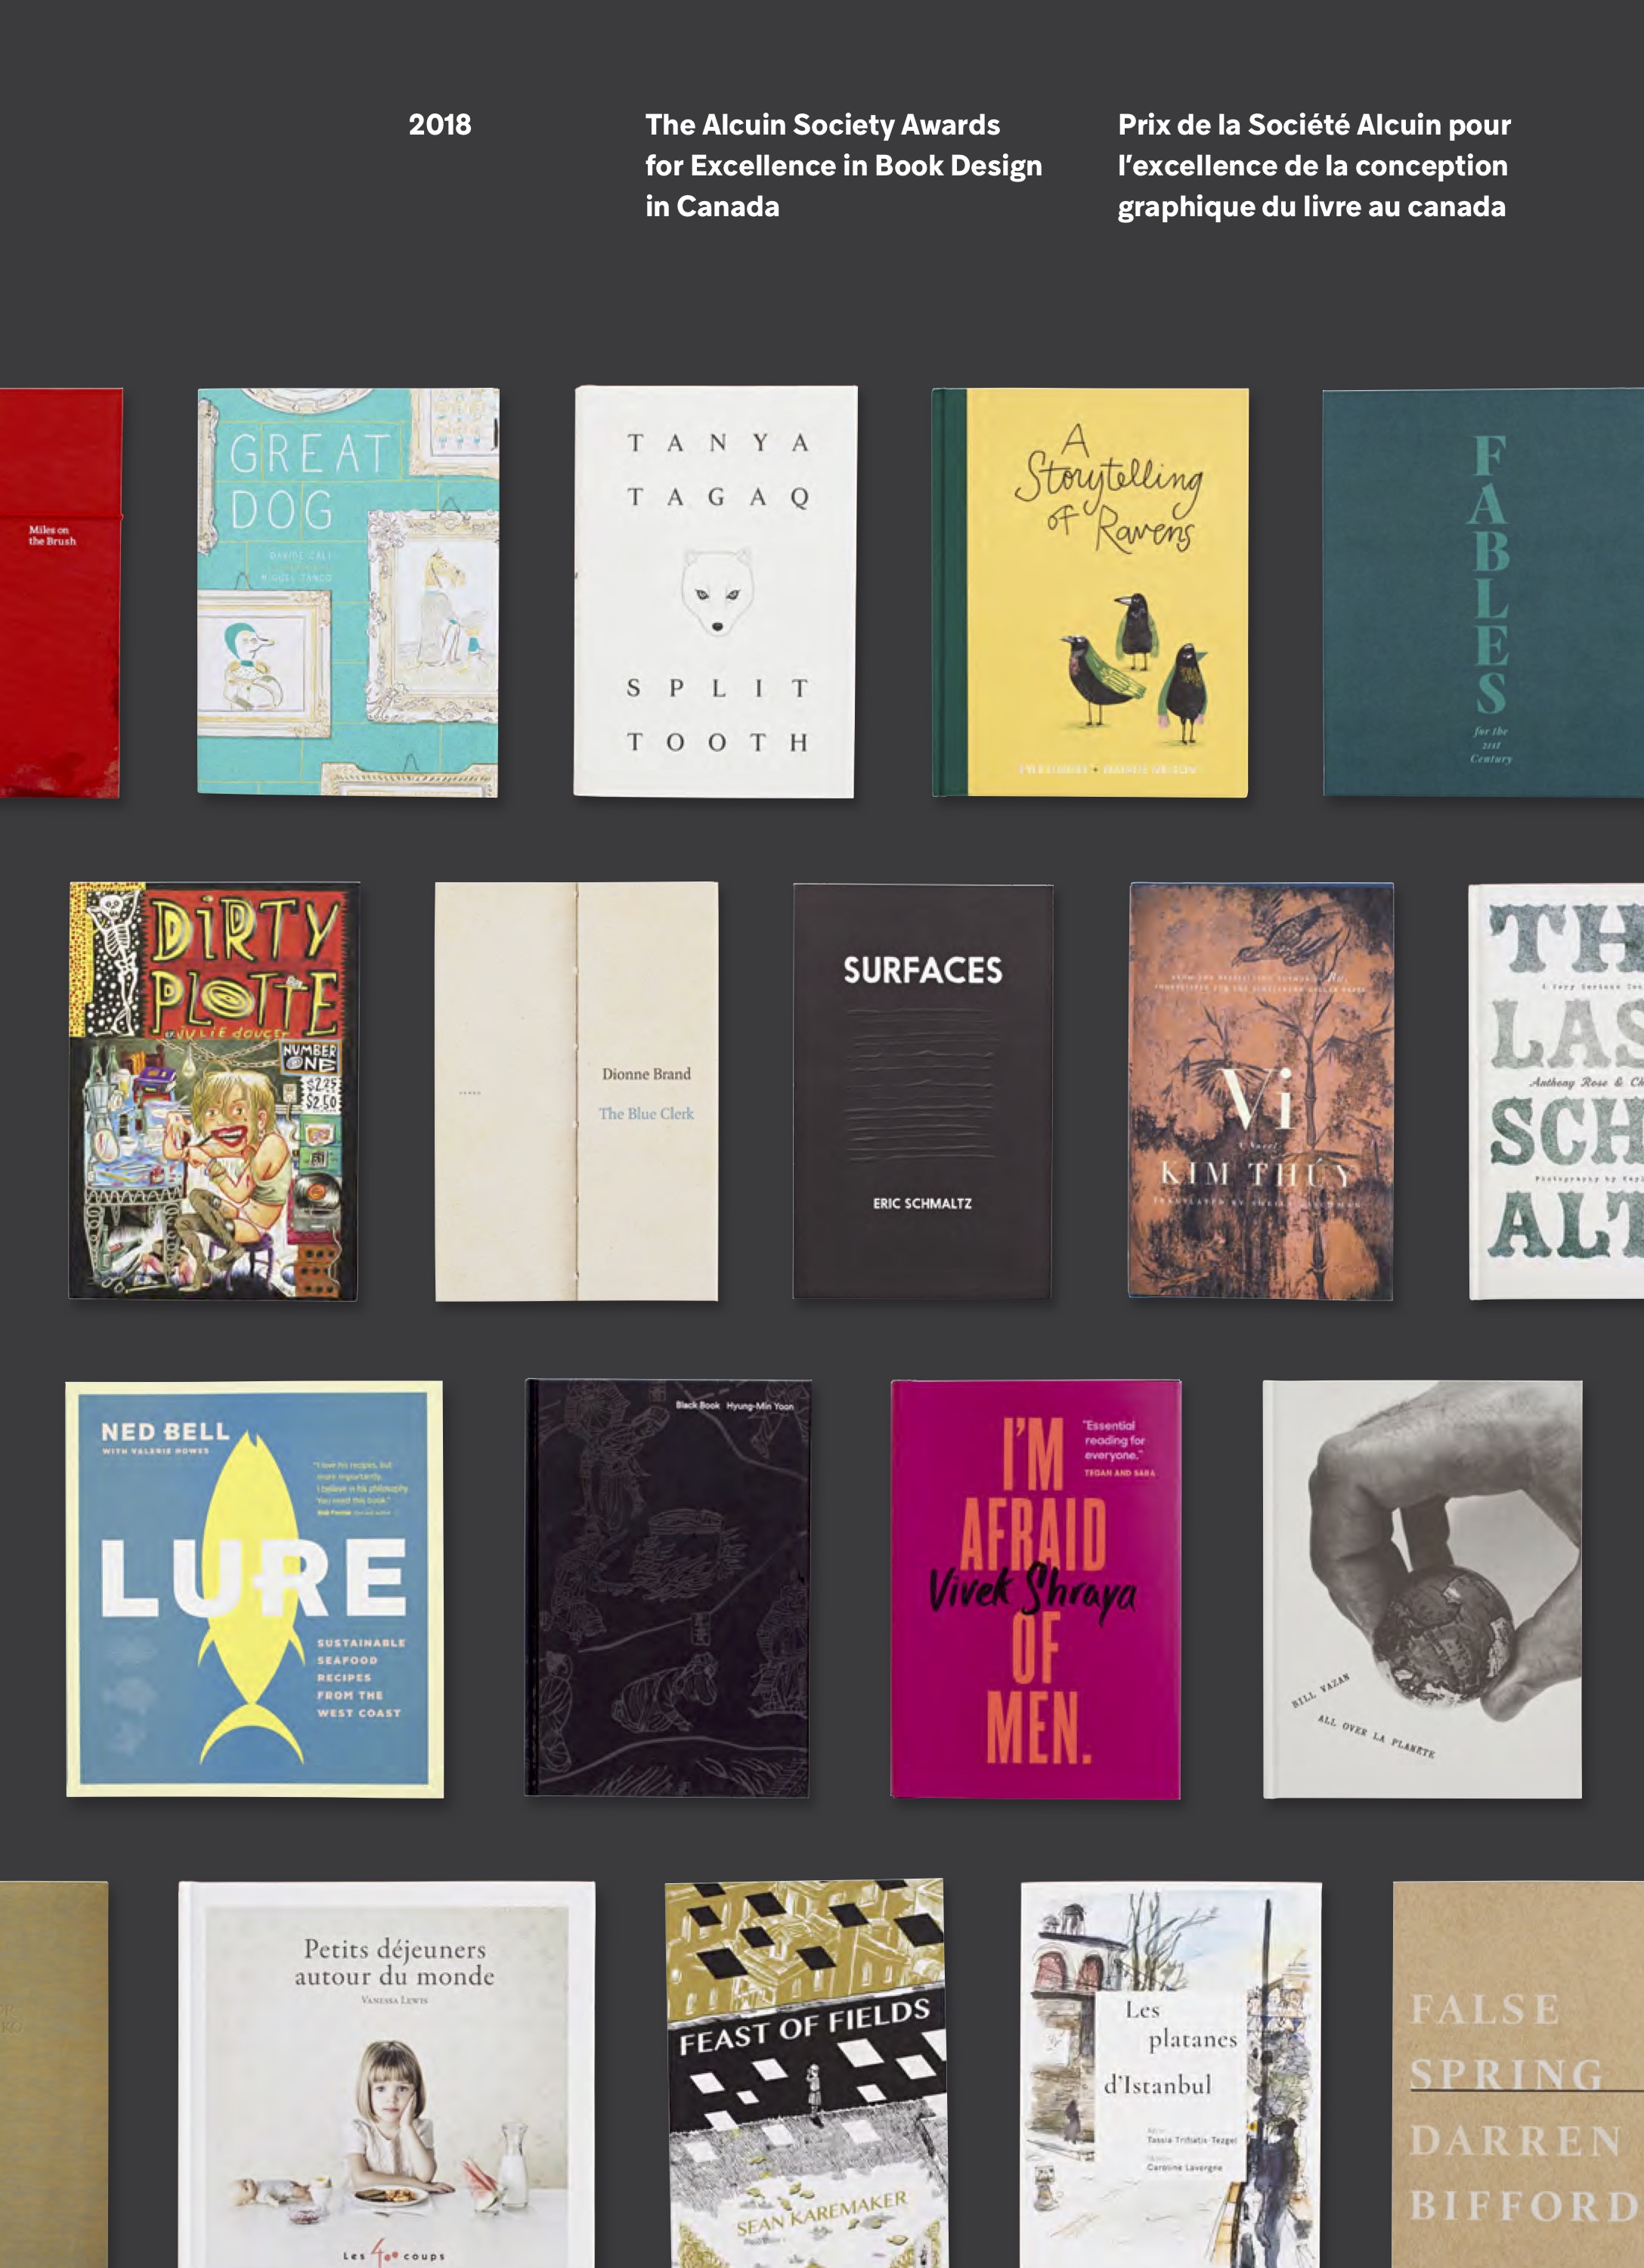
For the past few years, I’ve been slowly poking away at a data project related to the history of book design in Canada. My goal was to produce a complete list of all the winners of the Alcuin Society Awards for Excellence in Book Design in Canada and I’m happy to say that this project is finally complete, or at least complete enough to release online. You can download the dataset here. The Society has been giving out awards for book design since 1981. Now, 37 competitions later, the list of winners comprises something that could be called a dataset: 1,047 entries with information on the winning books and the people who designed them. This includes the prize awarded (first, second, third, honourable mention) and the category it was awarded under (e.g. Poetry, Prose Fiction, Reference, etc.) This dataset will be of potential use for reference, of course, but could also be the subject of analysis. I took a stab at some analysis myself for the 2019 Bibliographical Society of Canada annual conference in Vancouver, BC and provide a few notes from this presentation below. You can also see the slides from my talk. But first is a short explanation of how the dataset was created.
Creating the Dataset
I’ve been a member of the Alcuin Society since 2011, and started volunteering with the Society since 2013. After I started to get to know the Society better, I noticed that there was no online source listing the many Alcuin Awards winners over the years, and I took a step in this direction by developing a proof-of-concept relational database design as a class project during my degree program in archival and library studies at the University of British Columbia. Eventually, it became clear that the database idea was overcomplicating things: what was needed was an accurate listing. So I set about compiling one from the main sources available to me. I started in 2015, and look me a few years while working on it off and on: what follows is a somewhat painful account of creating a structured dataset from unstructured information; if this kind of thing doesn’t excite you, head to the next section about analyzing it!
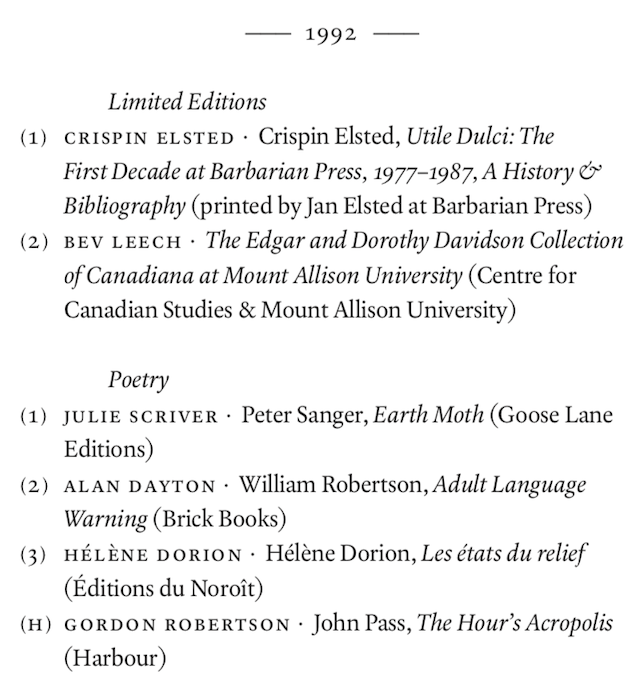
The two main sources for Alcuin Awards winners is Appendix 1 of Robert Bringhurst’s excellent The Surface of Meaning: Books and Book Design in Canada, and a document of winners after 2006 compiled by the Society’s journal editor Peter Mitham. I tackled the Appendix first. The Bringhurst Appendix was itself compiled from entries in the Society’s journal Amphora and individual Awards catalogues that started being published from 1996 onward. I scanned a copy of the Appendix and used Adobe Acrobat to run OCR (optical character recognition) on it. The goal was to turn each entry into structured text that could be separated out into columns for a spreadsheet. In order to do so, I needed a pattern that was consistent throughout. But the challenge was that though the Bringhurst-sourced entries followed a pattern, some of this pattern was around how the text was formatted, therefore making it challenging to extract consistently. For example, the names of designers were in caps followed by an interpoint and then the book’s author(s), title and publisher. The OCR scanning did not always represent the caps or interpoint correctly in the output, and it is hard to do text extraction based on formatting anyway. So once I had copied and pasted this text into a document, I manually coded each of the sections that required one by inserting a different character, like an asterisk. The rest already had a pattern that could be used for text separation, such as the publisher names in brackets, and book titles beginning with a comma. This then enabled me to use Excel formulas like MID to separate out the different text elements into columns. I’m sure there are smarter ways of doing this, but this seemed like the right balance of time spent researching a method vs. time just doing it the way I knew already.
The main challenge was more to do with the accuracy of the OCR output: I had to spent a lot of time cleaning up rough OCR, which really slowed the process down and is mostly why I kept leaving the project off for more fun things. I discovered way too late that members of the Society had a digital version of the Appendix on hand, which would have saved a ton of time. A lesson: in data projects, find the best source possible before you begin! The document from Peter was a bit easier to work with, since it had a fairly standard structure that I could use formulas to parse.
After getting the data structured, I spent a good amount of time using the tool OpenRefine cleaning it up further. A lot of this involved getting rid of leading and trailing spaces and making sure publisher and designers’ names were spelled correctly. I made sure that entries with more than one designer or publisher name were separated by a slash so it would be easy to parse these apart if required.
I also discovered some issues with the Bringhurst Appendix during the compilation process. For one, the Appendix changed the way that Awards categories were represented over the years. For example, “Juvenile” was used as a category until 1995, when it switched to “Children,” but Bringhust uses “Children” throughout. It made sense to maintain this intervention, since these categories are essentially the same. But I ended up creating a companion document that includes a detailed list of the different categories used for Alcuin Awards over the years in case individuals were interested, as well as the names of the judges for each year for good measure. I also noted a more serious issue in the Bringhurst Appendix that you would not notice at first glance unless you had the original source materials in hand: the winners from 1995 are missing. The reason is rooted (I think) in a source of confusion about how the Awards have been represented over the years. In order to understand it, you first have to know that the Awards always take place in the year following a book’s publication. At the beginning of the new year, publishers are asked to submit books published in the prior year. So, for the Awards that took place this year (2019), the books being recognized were published in 2018. In the past, the Society would sometimes refer to something like the “Awards for 1988” for a list of winners; this could mean this listing was for books published in 1987, if they were referring to the year the awards took place, or 1988, if they were referring to the year the books were actually published. In 1996 the Society started printing an independent catalogue of winners and labeled this catalogue “1996.” But the books listed in this catalogue were for 1995. For some reason, this catalogue was omitted from the Appendix, but I assume the year confusion issue is why. Luckily, I was able to find a copy of the catalogue and include it in the new listing.
Analyzing the Dataset
A big push to see the preparation of the Awards data to the finish was being asked by the Society to submit a paper to the 2019 Bibliographical Society of Canada conference in Vancouver. The BSC specifically called for papers about book design, and the Society thought it would be nice to see some representation of its efforts at the conference. This was really the perfect motivation to see this project through and to start thinking about how the dataset might be used, so I jumped at the chance. I was glad to be joined at the conference by Peter Mitham who presented a great paper on the broader historical context of the Society.
My main research question was whether the awards show a growth or contraction in relative numbers of new winning designers over time. Do the same names get represented over and over? Or do we see a greater diversity in terms of numbers of designers? In some ways the Awards don’t have great long-term memory; this tends to be how awards work generally. Designers are celebrated each year and the focus is on the winners of that particular year. Then a year goes by and the focus switches to the new group of winners. I was curious how changes over time might be reflected in the dataset of winners.
After presenting a short history of the Awards, I presented some basic initial stats:
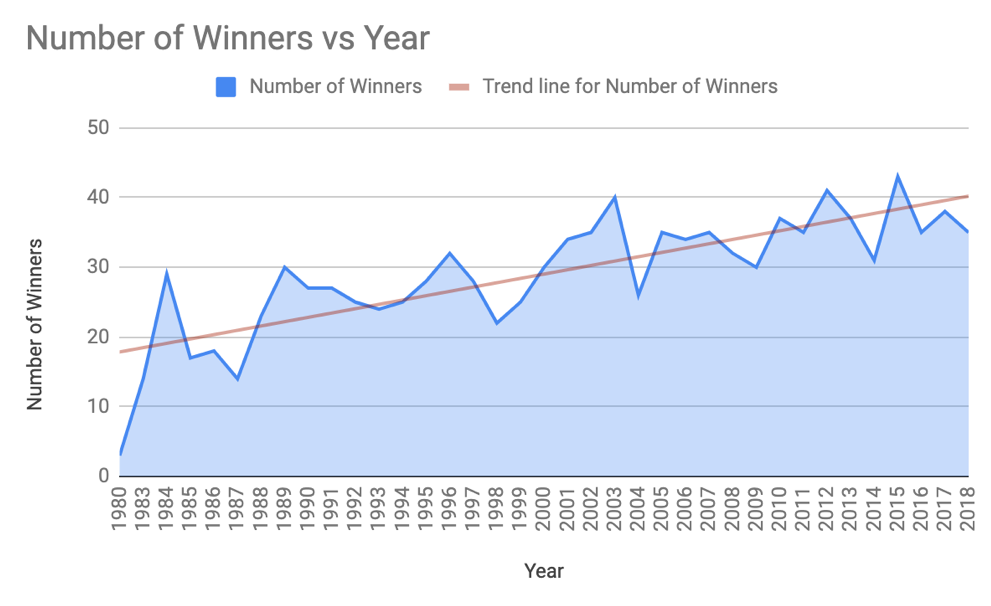
- The numbers of winners have slowly risen over time, but has never exceeded 43 winners. The average is 29 winners per year.
- Numbers on submissions per year are incomplete, but in general the maximum number of submissions seems to have been 375 books in 1997 and has stabilized to around 200-250 submissions per year since then.
- Prizes have been relatively evenly distributed: First, Second and Third Prizes each constitute 22-24% of wins, while honourable mentions constitute almost 30% of citations.
- Designers generally work alone: 14% of the winners were collaborations between 2 or more designers, though this does not account for citations attributed to a group, like the name of a studio.
Then I started looking at the designers more specifically. I extracted the names of 504 individual designers named across 1,242 citations (this number is accounting for collaborations). 9 designers had each received over 20 citations, making them constitute 26% of the group of named designers overall. At the other end, 359 designers had won only one award, constituting another 29%. The rest were in the middle, having won between 2 and 20 awards.
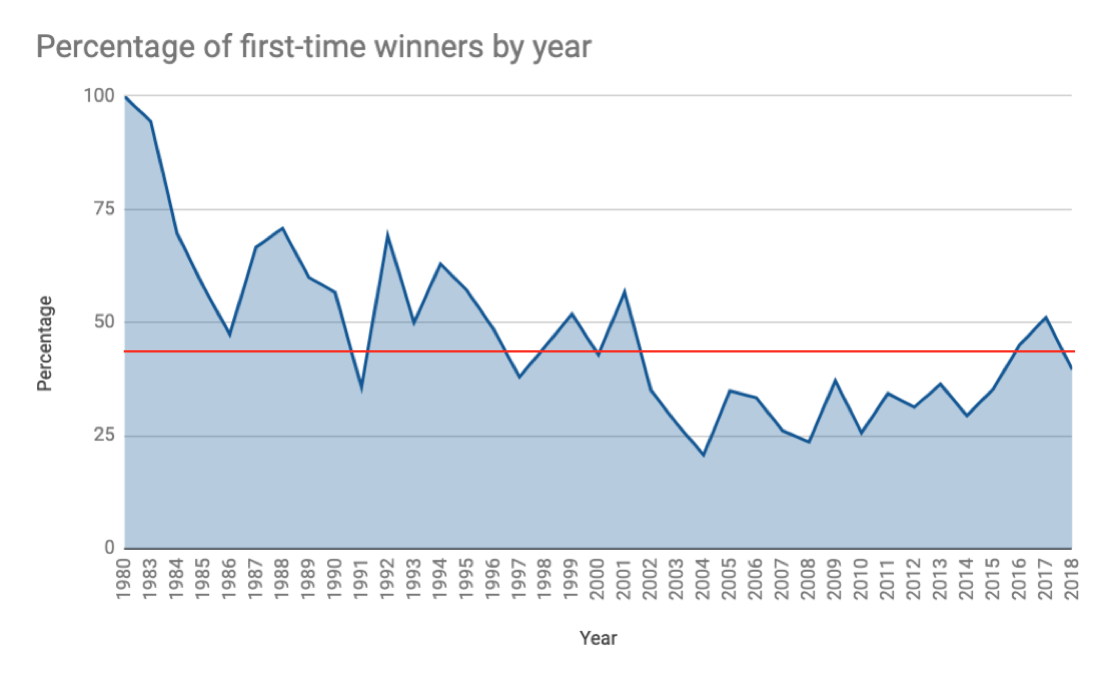
Taking a closer look at this, I produced a chart of the relative number of first-time winners per year. For example, in 1983, 17 out of the 18 names represented were winning for the first time, making for a percentage of first-timers at 94%. This makes sense, since the Awards were new and few designers had been recognized by that point. But later on is where things start to reveal themselves. As you would expect, the number of winners starts off strong, and remains generally high through the 1990s - each year, and with an increasing number of submissions. The average of first-timers per year for the period from 1983, when the Awards became a consistent activity, and 2000, is 56%. This number declines after 2000; the average of first time winners from 2001 to 2018 (almost the same length of time) is 35%. So, there is a noticeable downturn in first-time winners after 2000. But as you can see, there is also a bit of an uptick again in 2016 and 2017 at 45% and 51%, respectively.
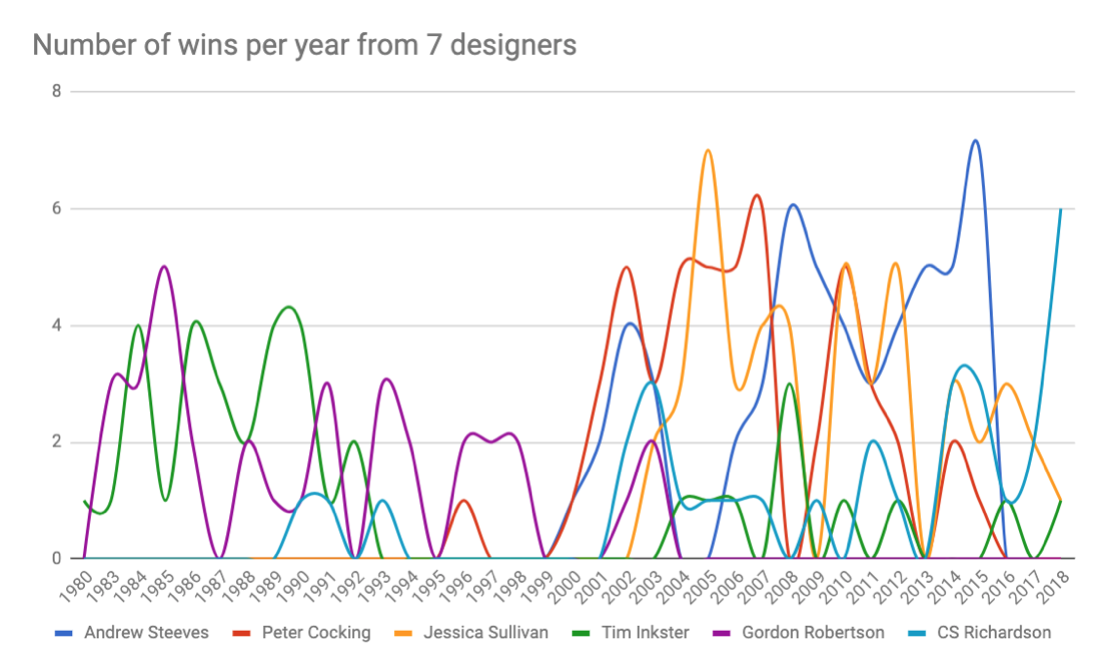
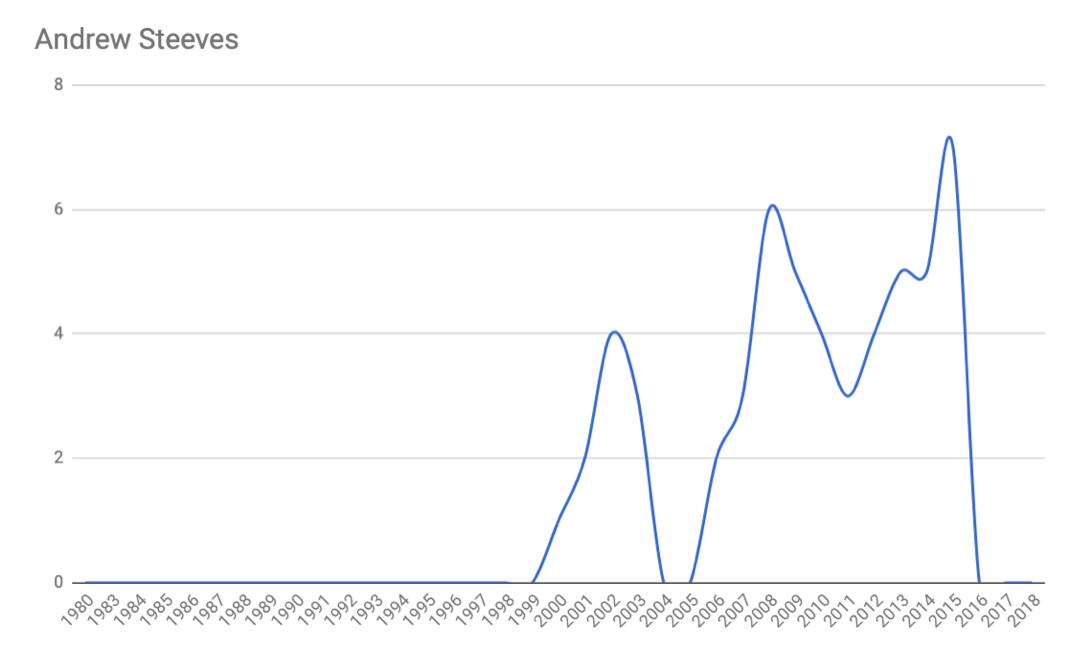
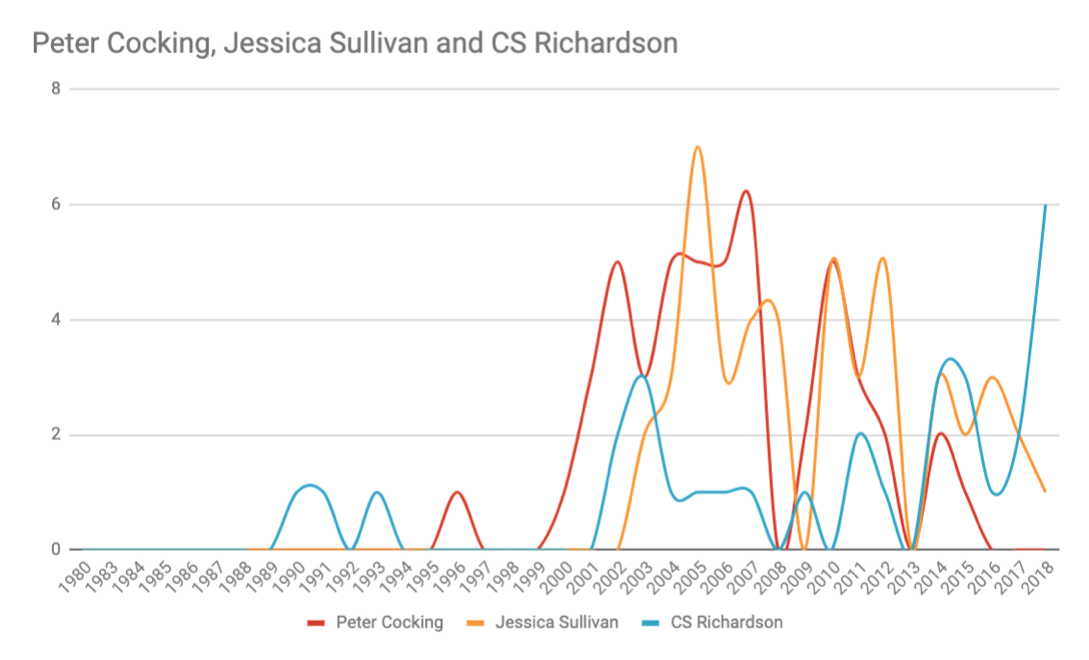
How might we account for this decline, and the subsequent uptick? Next up, I took a look at the top winning designers. What is fascinating is that of the top 10 designers, 6 of these started winning, and in fairly high proportions, after 2000. I charted the careers of 7 of the top 10 designers in another series of charts. You can see that an earlier, smaller cohort, has been winning consistently over time: Tim Inkster of The Porcupine’s Quill, and Gordon Robertson, who worked with Coach House and Mercury Press among others, have been winning awards since the 1980s. But later, starting with his first win in 2000, arrives the phenom that is Andrew Steeves of Gaspereau Press. Gaspereau is an example of an independent press whose work extends from the vision and dedication of a single individual with a high level of control over the press’s outputs. This has meant killing it on the Alcuin Awards front: Steeves won 54 citations from 2000 to 2015. Steeves’ chart shows a major decline after cleaning up with 7 citations in 2015 for a single reason: he stopped submitting books to the Awards with the view of “mak[ing] way for the next generation of emerging designers” (see his Instagram post on this). Another chart of three other designers; Peter Cocking, Jessica Sullivan, and CS Richardson, represents a group of consistently successful designers working in the 2000s to the present.
So, what does all this mean? I posit that there is evidence of a cohort of winning designers that established itself in the 2000s and which has continued into the present. This cohort might represent an investment in design by publishers beginning in the 2000s, and in particular, a small group of designers. Top winners like Tim Inkster and Andrew Steeves are evidence of the continued place of independent publishing in relation to successful design. In the catalogue for 2006, judge Alan Brownoff noted that “there continues to be a small group of core book designers in Canada that consistently produce quality work for the publishers who employ them,” which my analysis confirms. It would be interesting to flesh this out with more qualitative approaches to this information by talking to designers and publishers about the industry during this time. Was design a going concern and area of investment due to the (potential) destabilization of the print market due to digital products? Do the designers identified here feel the Awards benefited them? Or was their recognition simply incidental?
Secondly, what to make of the more recent uptick in new designers? Andrew Steeves’ intervention must have had an effect, though that in itself would not necessarily guarantee new names. Another effect was definitely the introduction of the prize category for Comics in 2016; this entered new kinds of names that had not appeared in the competitions before. There is also an interesting observable trend of new designers picking up multiple awards after 2010; people like Natalie Olsen (13 wins since 2013), Kelly Hill (7 wins since 2012, plus two more in 2004 and 2007); Terri Nimmo (8 wins since 2012) and Jennifer Griffiths (already at 7 wins since 2017). I suspect these individuals represent an incoming cohort of new designers who are gaining work at established publishers.
I also touched on publishers in my presentation, though in not as much detail. The general number of first-time winning publishers stabilized at an average of 29% in the early 1990s and has remained about the same since - clearly the sign of some consolidation. The loss of Douglas & McIntyre in 2012 might account for a slight uptick in average numbers of new publishers after that date.
As I mentioned before, this is all very much a first attempt at working with the Alcuin data. But it shows that this dataset can provide an interesting entry point into the history of publishing in Canada. While there are lots of variables, external factors and contexts it cannot answer, there are distinct patterns that could lead to interesting future investigations. And at the very least the Society now has a decent reference for its winners online, which I encourage you to explore and interrogate yourself!